The OrnisNest platform
One connected system for your whole poultry operation.
OrnisNest brings farms, flocks and every daily record (eggs, feed, water, mortality and weights) into one shared workspace, so owners, managers and farm teams work from the same numbers.
Platform overview
Everything connected. Nothing scattered.
Every record belongs to a flock, and every flock to a farm. That structure is what turns daily data entry into an operating history you can rely on.
Operations overview
All farms · Sunday, 18 October 2026

Overview
Reporting period
Active birds
72,400
Across 3 farms
Active flocks
8
Layers & broilers
Eggs today
33,900
Layer flock records
Feed today
7,300 kg
All recorded feed
Egg production · Green Valley
234,600
eggs this week

12–18 Oct 2026 · Daily recorded egg count
Flocks at a glance
Flock
Farm
Type
Live birds
Stage
GV-L01
Green Valley
Layer
20,000
Laying
RT-B01
Riverside
Broiler
12,400
Growing
Illustrative workspace and farm data. Shown to demonstrate the platform, not customer results.
Structured by design
Farm → flock → daily record. Every entry has a clear home.
Shared by the team
Owners, managers and workers see the same records.
Built for daily use
Quick, consistent entry for the records kept every day.
01 / Farm management
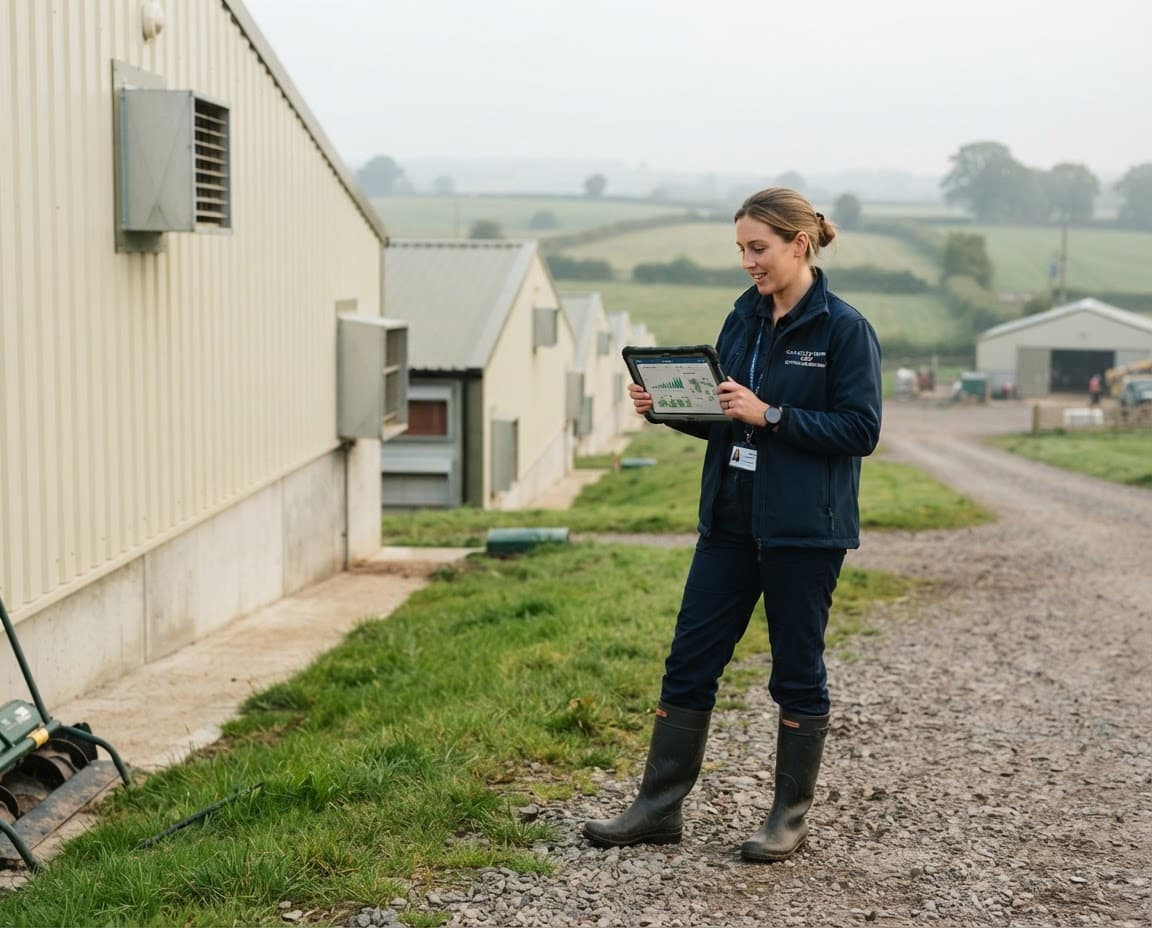
Every farm and team in one place.
Set up each farm, then invite the people who work there. Owners and managers get the full view; farm teams see what they need for the day.
- Multiple farms in one workspace
- Invitations by email
- Owner, manager and worker roles
- Farm-level summaries
Green Valley
4 flocks · 40,000 birds
Riverside
2 flocks · 12,400 birds
Hilltop Poultry
2 flocks · 20,000 birds
Illustrative farms
02 / Flock management
Flock records from placement onward.
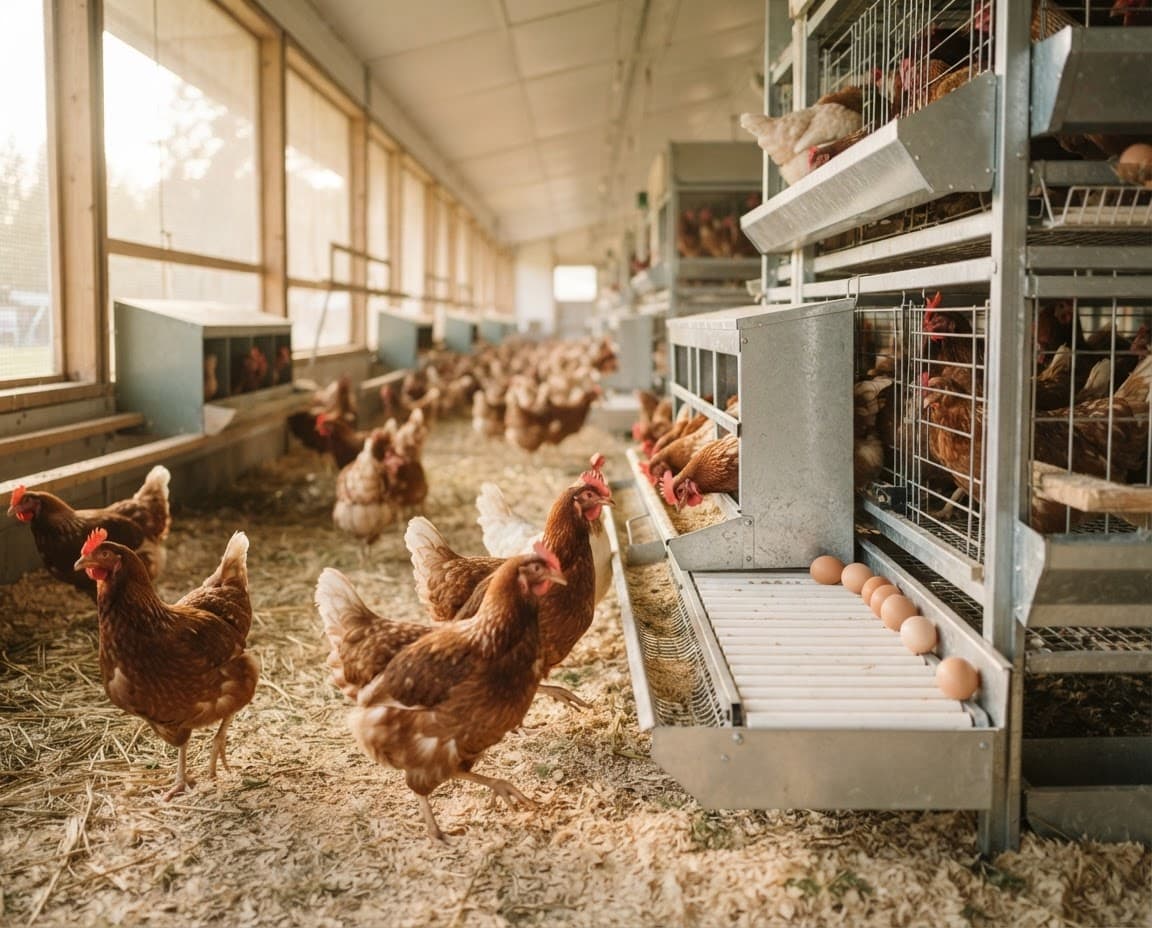
Register layer and broiler flocks with placement date, bird count, breed and hatch date. Follow age and lifecycle stage, and keep every record tied to the flock it belongs to.
- Layer and broiler flocks
- Placement, age and lifecycle stage
- Live bird counts
- Flock history at a glance
RT-B01
Riverside · House 2 · Broiler
 Active
Live birds
12,400
Live count
Mean weight
1.85 kg
Latest sample
Lifecycle · Day 28
Placed
Growing
Finish
Illustrative flock record
03 / Production monitoring
Daily egg production, recorded consistently.
Record eggs collected and cracked eggs for every flock, every day. Laying percentage and cracked percentage are worked out for you, with no spreadsheets to assemble.
- Daily egg counts per flock
- Cracked eggs and cracked %
- Laying percentage
- Corrections that keep the history intact
Egg production · Green Valley
234,600
eggs / week
Illustrative data · Daily recorded egg count
04 / Health and mortality
Bird health and mortality, on the record.
Record daily deaths and culls against the right flock, and the live bird count updates automatically. Vaccination, treatment and vet visit records are coming soon.
- Daily deaths and culls
- Live bird count kept up to date
- Daily and cumulative mortality %
- Vaccinations and vet visits (coming soon)
Mortality records · All farms
34
birds / week
Illustrative data · Daily mortality count
Recent health events
Mortality
RT-B01 · 5 birds · 18 Oct
Cull
GV-L02 · 3 birds · 17 Oct
Vaccination
Coming soon
05 / Feed and water
Know where the feed goes.
Record feed issued and water used by each flock every day. See usage per bird and across farms, so feed, usually your largest cost, is always accounted for.
- Daily feed issued
- Water used (optional)
- Per-bird feed and water
- All-farm feed totals
Feed consumption · All farms
50,680
kg / week
Illustrative data · Daily recorded feed (kg)
06 / Growth and weight
Growth and weight, sample by sample.
Record bird weight samples for broiler and pullet flocks and follow mean weight across the cycle. Compare growth against your own targets.
- Weight sample entry
- Mean sampled weight
- Growth curve per flock
- Your own target weights
Bird weight · RT-B01
1.85
kg / latest sample

Illustrative data · Mean sampled bird weight (kg)
Sample size
50
Birds weighed
Flock age
Day 28
Since placement
Live birds
12,400
Live count
Stage
Growing
Lifecycle
07 / Farm finance
Know what the farm earns and spends.
Record egg, bird and manure sales, the payments against them, and every expense from feed to labour. Link a cost to the flock it belongs to, see who still owes you, and compare eggs collected with eggs sold, right beside your production records.
- Egg, bird and manure sales
- Payments, including M-PESA codes
- Expenses by category and flock
- Monthly revenue and expense summaries
Income
US$4,860
October to date
Expenses
US$3,410
October to date
Largest cost
Feed
68% of expenses
Records
42
This month
Recent transactions
Illustrative data
08 / Analytics and reporting
Reporting that brings it all together.
Read daily trends across eggs, feed, water, mortality and growth for every flock, and see when a number moves out of line.
- Flock performance pages
- Multi-flock dashboard
- Daily KPIs worked out for you
- Connected operational history
Feed consumption · All farms
50,680
kg this week
12–18 Oct 2026 · Illustrative feed records
Latest operational records
Farm
Record
Value
Green Valley
Eggs
33,900
Riverside
Weight
1.85 kg
START YOUR FREE TRIAL
See your operation in one workspace.
Start a free trial and see a platform built around how poultry businesses really work.
For poultry businesses ready for a clearer way to operate.